
KTX ◆ Cattleman Capital · Market Read
Is Housing Warning Producers?
October's existing-home sales print, the financial channels that carry it, and what already shows up in construction spending.
Jason Cox, Consulting Division, KTX Cattleman Capital · 26-11-12 · As of 26-11-12 10:22 AM CT

Existing-home sales in October fell to 3.75 million at a seasonally adjusted annual rate, a preliminary figure, down 5.5% from a revised 3.97 million in September and 8.8% from a year earlier. The National Association of Realtors called it the lowest level since August 2010 (NAR, released 26-11-12; verified).
For owners and operators in ready-mix, cement, precast, aggregates, import terminals and SCMs, the question is whether the financial-market signal has already reached the order book, and through which channels.
This is a backward-looking read of published data, not a forecast.
What the print is, and what it is not
This is a sales-volume story, not a distress story. The median existing-home price was $416,700 in October, up 0.4% from a year earlier and the 40th consecutive month of year-over-year gains. Distressed sales were 2% of transactions, unchanged from September and from October 2025. Inventory rose to 1.59 million units, a 5.1-month supply, from 4.7 months in September and 4.4 months a year earlier (same NAR release; verified).
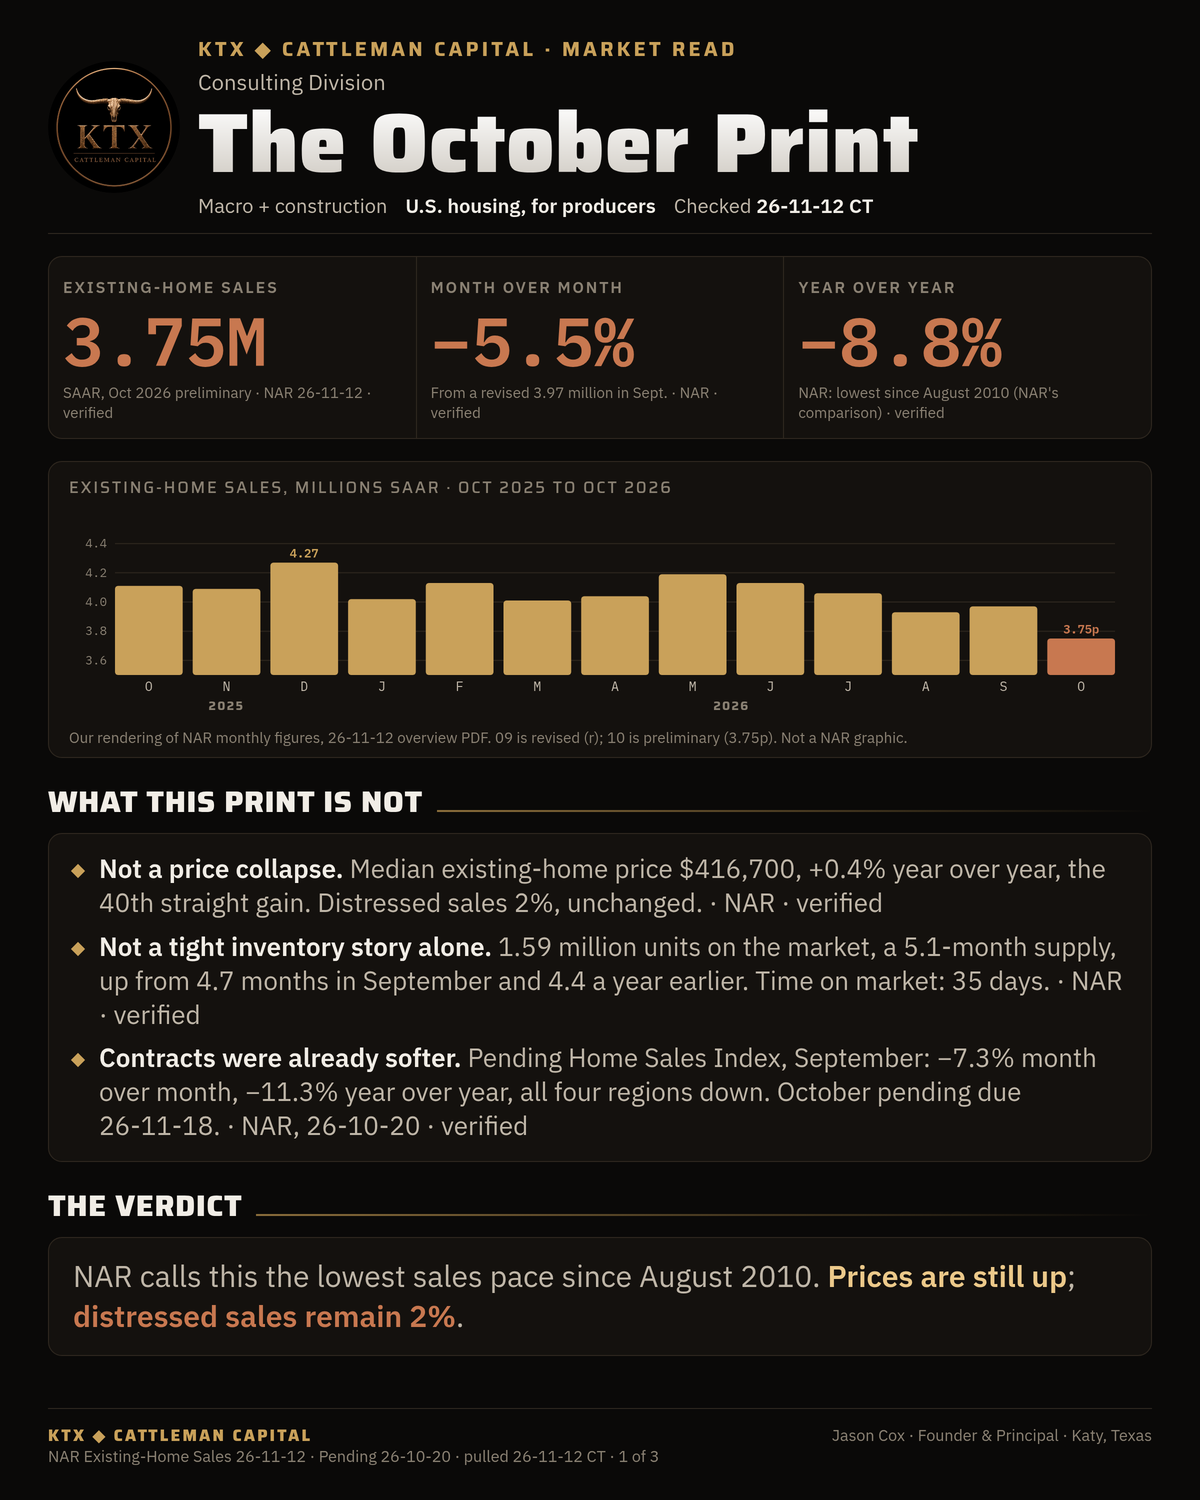
Contracts in the pipeline were already softer. NAR’s Pending Home Sales Index fell 7.3% in September and 11.3% from a year earlier, with declines in all four regions (NAR, 26-10-20; verified). The October pending report is due 26-11-18.
A one-week bounce in mortgage applications does not erase the year-over-year gap. For the week ending 26-11-06, the Mortgage Bankers Association’s Purchase Index rose 8% on a seasonally adjusted basis and was still 18% below a year earlier on an unadjusted basis (MBA, 26-11-12; verified).
How financial markets reach a plant
Buyers and builders borrow against long rates. The 30-year fixed mortgage averaged 7.33% in October, up from 6.86% in September and 6.25% a year earlier, according to Freddie Mac figures reported by NAR and confirmed from Freddie Mac’s weekly survey file. By the week of 26-11-05, the weekly average had eased to 7.18%, the third consecutive weekly decline. A year earlier it was 6.22% (Freddie Mac PMMS; verified, pulled 26-11-12).
The 10-year Treasury note, which sets the backdrop for mortgage pricing and for the permanent loan a construction loan is meant to refinance into, closed at 4.98% on 26-11-10, the last official close before this package. It had closed at 4.86% on 26-11-06 (U.S. Treasury daily par yield curve; verified, pulled 26-11-12).
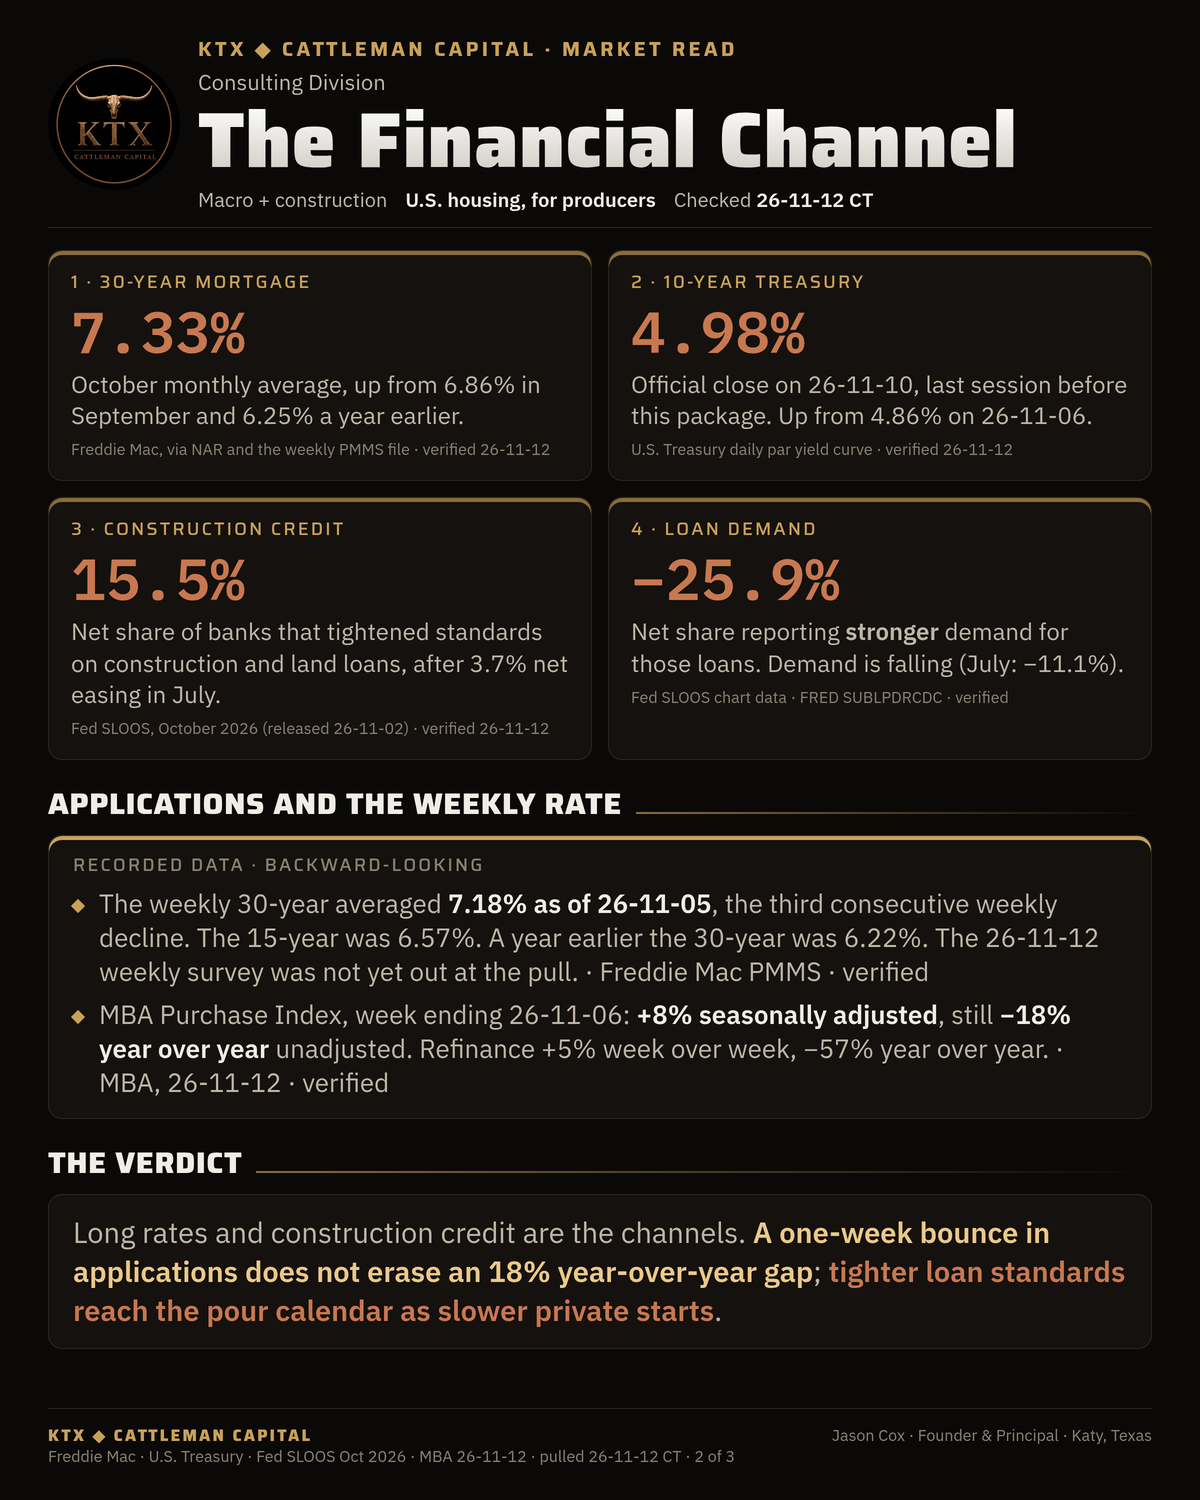
Credit standards are a second channel, and they moved in the same direction. In the Federal Reserve’s October 2026 Senior Loan Officer Opinion Survey, released 26-11-02, a net 15.5% of domestic banks tightened standards on construction and land development loans, after a net 3.7% eased in the July survey. A net 25.9% reported weaker demand for those loans, after a net 11.1% reported weaker demand in July. Banks also tightened, on net, for nonfarm nonresidential and multifamily loans, 8.8% in each category (Fed SLOOS; chart data; verified, re-checked 26-11-12).
Higher mortgage rates slow closings. Tighter construction credit slows starts. Both show up, with a lag, as fewer yards poured and fewer tons shipped.
What already shows up in the book
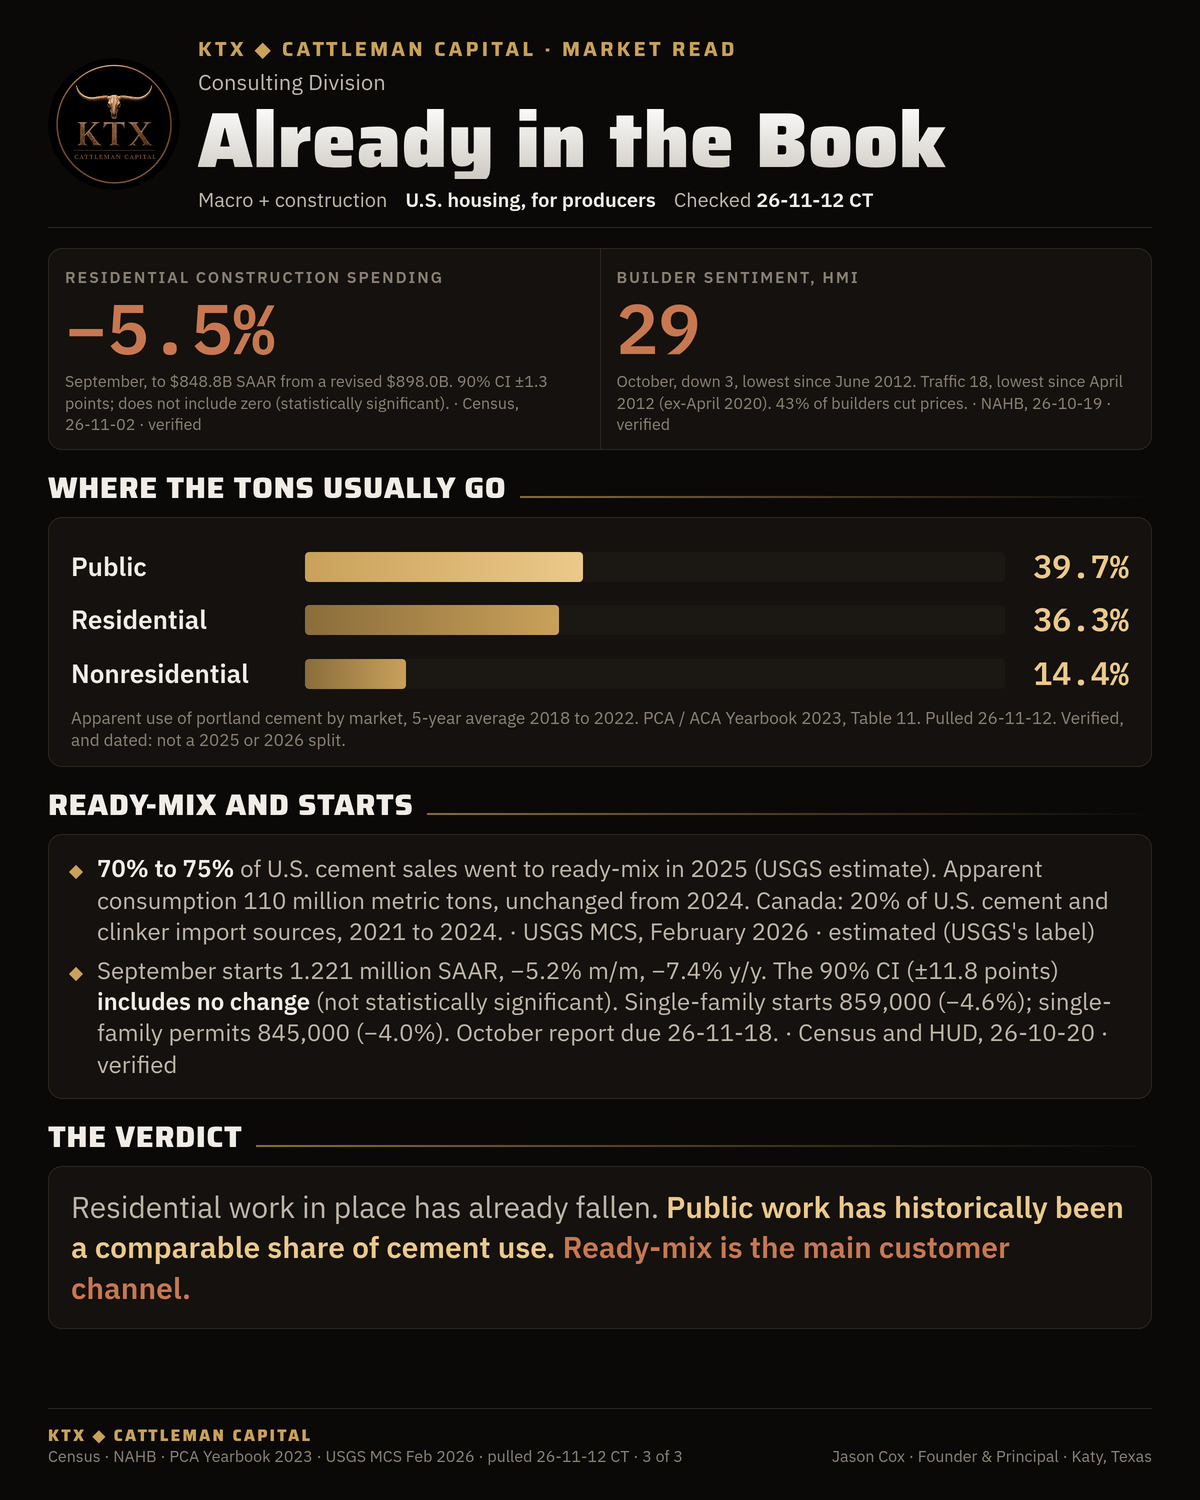
Residential construction spending fell 5.5% in September, to $848.8 billion at a seasonally adjusted annual rate, from a revised $898.0 billion in August (Census Bureau, 26-11-02; verified). The 90% confidence interval was plus or minus 1.3 percentage points and does not include zero. That drop is statistically significant. Total construction spending was $2,186.1 billion, down 1.9%. Private construction was $1,639.3 billion, down 2.4%.
Housing starts in September were 1.221 million at a seasonally adjusted annual rate, 5.2% below a revised August and 7.4% below September 2025 (Census and HUD, 26-10-20; verified). The 90% confidence interval on the monthly change is plus or minus 11.8 points and includes no change, so that monthly drop is not statistically significant. Single-family starts were 859,000, down 4.6%. Building permits were 1.400 million, almost unchanged from August and 3.0% below a year earlier. Single-family authorizations were 845,000, down 4.0%. The October starts and permits report is due 26-11-18.
Builder sentiment has already rolled over. The NAHB/Wells Fargo Housing Market Index fell to 29 in October, down 3 points from September and the lowest reading since June 2012. The traffic component was 18, the lowest since April 2012, excluding April 2020. Forty-three percent of builders cut prices, and 65% used incentives (NAHB, 26-10-19; verified).
Where the tons usually go
Housing is a large share of the cement and ready-mix book, but it is not the whole book. In the American Cement Association’s 2023 Yearbook (Table 11, apparent use of portland cement by market), residential buildings accounted for 36.3% of use on a five-year average from 2018 through 2022. Public construction accounted for 39.7%. Nonresidential buildings accounted for 14.4% (ACA; verified, and dated). Those shares are several years old. They describe the structure of the market, not the 2026 split, and I am not treating them as a current reading.
The more recent customer-channel figures are from the U.S. Geological Survey’s Mineral Commodity Summaries, February 2026. For 2025, USGS estimates that 70% to 75% of cement sales went to ready-mixed concrete producers. Apparent consumption was estimated at 110 million metric tons, unchanged from 2024. Canada accounted for 20% of U.S. hydraulic cement and clinker import sources from 2021 through 2024 (USGS; 2025 figures are USGS estimates). This package is a U.S. housing print. Canadian producers and U.S. terminal operators who handle those import tons will feel a U.S. residential slowdown at the terminal and in ready-mix, not through a Canadian housing figure I do not have.
A historical warning, not a call
Edward Leamer argued in 2007 that residential investment has historically been the most useful early-warning sector for U.S. recessions, even though its share of GDP is small (NBER Working Paper 13428; verified as to thesis). Later work, including Richard Green’s 2021 paper (USC Lusk), put the question again. I am not using either paper to call this cycle. A weak sales print is a fact. It is not, by itself, a verdict on the broader economy, and it is not a price forecast.
What the recorded data show is more limited, and more useful on a plant floor. Financing conditions tightened through the 10-year, the mortgage rate and construction-loan standards. Existing-home sales and pending sales fell. Residential construction spending fell by a statistically significant amount in September, and builder sentiment is at its lowest reading since June 2012. Public work has historically been a comparable share of cement use. The practical question is which part of each producer’s book is still funded, and on what terms.
After 25+ years working with building-materials producers across the U.S. and Canada, that is the review I would run on a backlog: credit source, pour calendar, and the mix between residential, nonresidential and public work.
Tie Your Horse to a Solid Post.
Sourcing notes
- Figures pulled 26-11-12, about 9:08 AM to 10:22 AM CT.
- Lawrence Yun’s remark that October mortgage rates were the highest since 2000, aside from one month in 2023, is not used. A recomputation of the Freddie Mac weekly file shows October 2023’s monthly average (7.62%) and November 2023 (7.44%) both above October 2026’s 7.33%.
- The American Cement Association yearbook states it may not be electronically redistributed; the PDF is not offered as a download from this site. The 2018 to 2022 shares are labeled dated.
- SLOOS figures (net 15.5% tightening, net 25.9% weaker demand) also appeared in the 26-11-10 Market Read, The Gathering Storm, as the credit channel in a two-tier Texas market. They are reused here only as the credit channel that transmits a national housing print into producers’ books.
Sources
- https://www.nar.realtor/newsroom/existing-home-sales-decreased-5-5-percent-october-nar-report
- https://www.nar.realtor/research-and-statistics/housing-statistics/existing-home-sales
- https://www.nar.realtor/newsroom/pending-home-sales-decreased-7-3-percent-in-september
- https://www.freddiemac.com/pmms
- https://www.freddiemac.com/pmms/docs/historicalweeklydata.xlsx
- https://home.treasury.gov/resource-center/data-chart-center/interest-rates/TextView?type=daily_treasury_yield_curve&field_tdr_date_value=2026
- https://www.federalreserve.gov/data/sloos/sloos-202610.htm
- https://www.federalreserve.gov/data/sloos/sloos-202610-chart-data.htm
- https://newslink.mba.org/mba-newslinks/2026/november/mba-newslink-thursday-nov-12-2026/mortgage-applications-increase-in-latest-mba-weekly-survey/
- https://www.census.gov/construction/c30/current/index.html
- https://www.census.gov/construction/nrc/current/
- https://www.census.gov/construction/nrc/pdf/newresconst_202609.pdf
- https://www.nahb.org/news-and-economics/press-releases/2026/10/builder-sentiment-falls-on-rising-rates
- https://www.cement.org
- https://pubs.usgs.gov/periodicals/mcs2026/mcs2026-cement.pdf
- https://www.nber.org/papers/w13428
- https://lusk.usc.edu/sites/default/files/working_papers/HousingandBusinessCycle_Revisited_509.pdf
If a decision on your desk needs clearer context, send me a message.
Get the Cement & Concrete Week in Review by email: sourced reads for building materials producers in the U.S. and Canada. Subscribe on Substack
Jason Cox · Founder & Principal · Katy, Texas
First published on LinkedIn.