
Provided by KTX Cattleman Capital, in conjunction with Trading Spaces. Commentary for entertainment only. Not financial advice.
Week in Review · 26-11-06 07:00 CT
Rotation or Risk-Off? What Thursday's AI Selloff Actually Showed
Opinion and commentary from KTX.
Data as of 26-11-06 (closes of 26-11-05)
Was the post-midterm tech drop a rotation, or the start of something broader?
That is the question two public Instagram reels tried to answer after Thursday 26-11-05, when AI and chip stocks led one of the sharpest equity sessions of 2026. We treated every claim in those reels as data to check, not as instructions. Trade ideas, webinar invites and unverified quotes were left out. Only figures we could confirm from Reuters, CNBC, Fortune, AP and Ballotpedia appear below.
The print
The Nasdaq Composite fell 5.52% to 24,315.00 and closed more than 10% below its 26-10-06 record, confirming a technical correction. The S&P 500 dropped 4.36% to 7,353.73. The Dow Jones Industrial Average fell 3.44% to 51,523.06. All three posted their steepest one-day declines since the April 2025 Liberation Day tariff shock (Nasdaq had fallen 5.82% on 26-04-04). Closing index levels are the Reuters figures recorded in the 26-11-06 package fact-check. CNBC (26-11-05) confirms the rounded declines: Nasdaq about 5.5% into correction, S&P 500 about 4.4%, Dow about 3.4%, and the steepest one-day drops since 26-04-04.
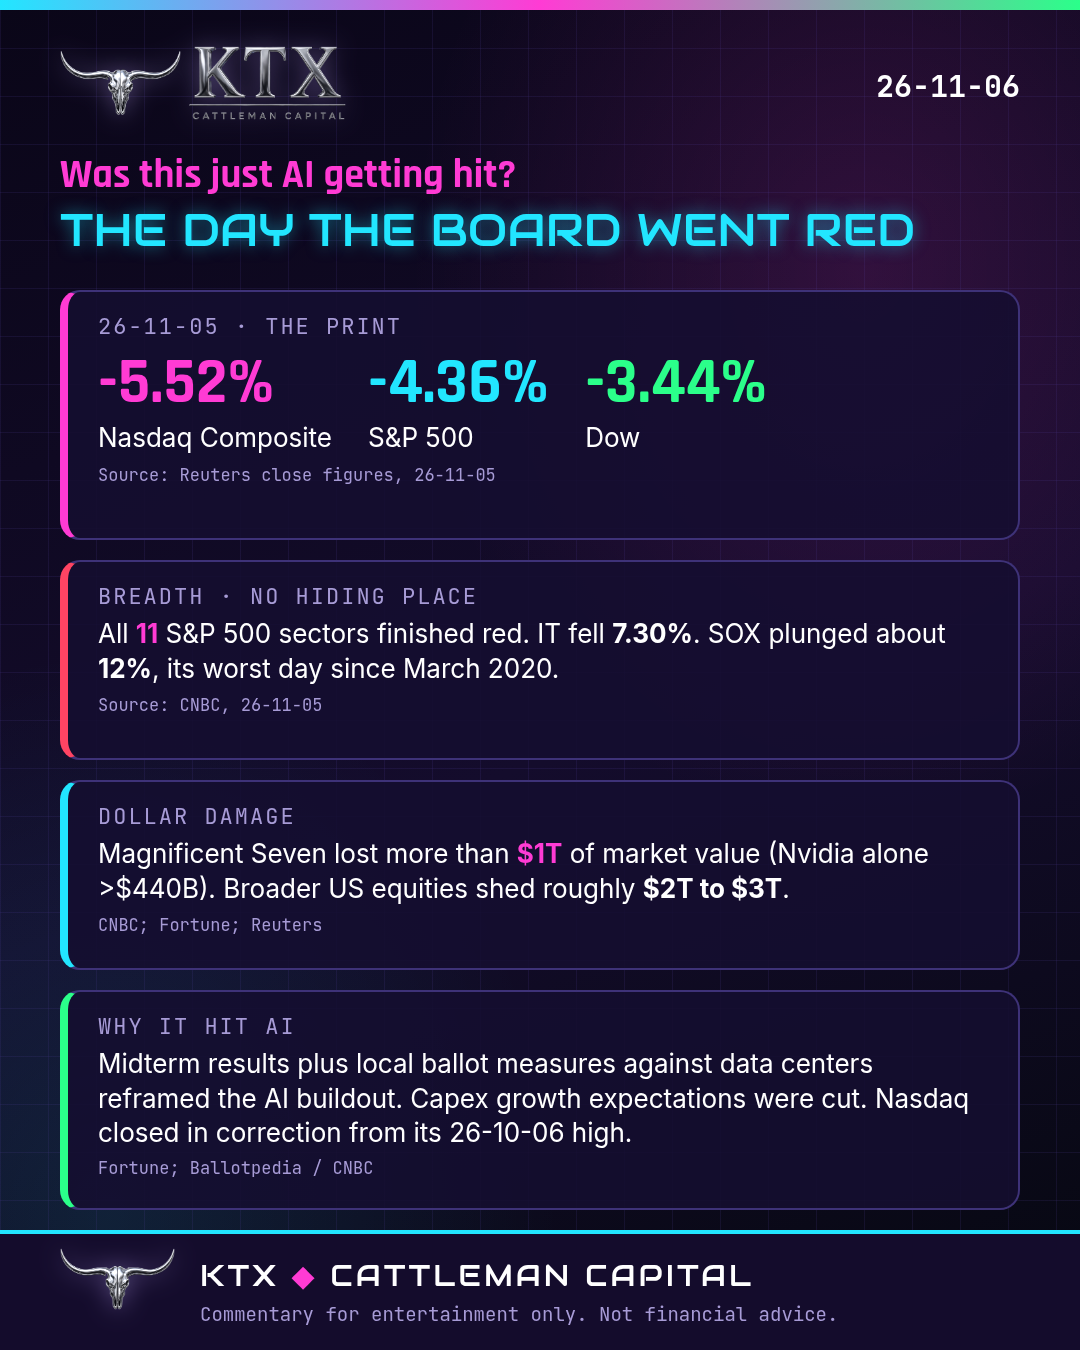
Breadth was as important as the headline indexes. All 11 S&P 500 sectors finished negative, led by information technology at -7.30%, its worst day since March 2020 (CNBC, 26-11-05; verified). The Philadelphia Semiconductor Index fell about 12%, also its worst session since March 2020. On the NYSE, decliners beat advancers nearly 6 to 1. The Magnificent Seven lost more than $1 trillion of market value, with Nvidia alone accounting for more than $440 billion (CNBC, 26-11-05; verified). Broader coverage put the market-wide dollar damage in a roughly $2 trillion to $3 trillion range (Fortune, 26-11-05; Reuters). A large dollar figure does not make a day a historic percentage crash. On a percent basis, Thursday was brutal and recent, not a top-10 Nasdaq wipeout.
Why AI sat at the center
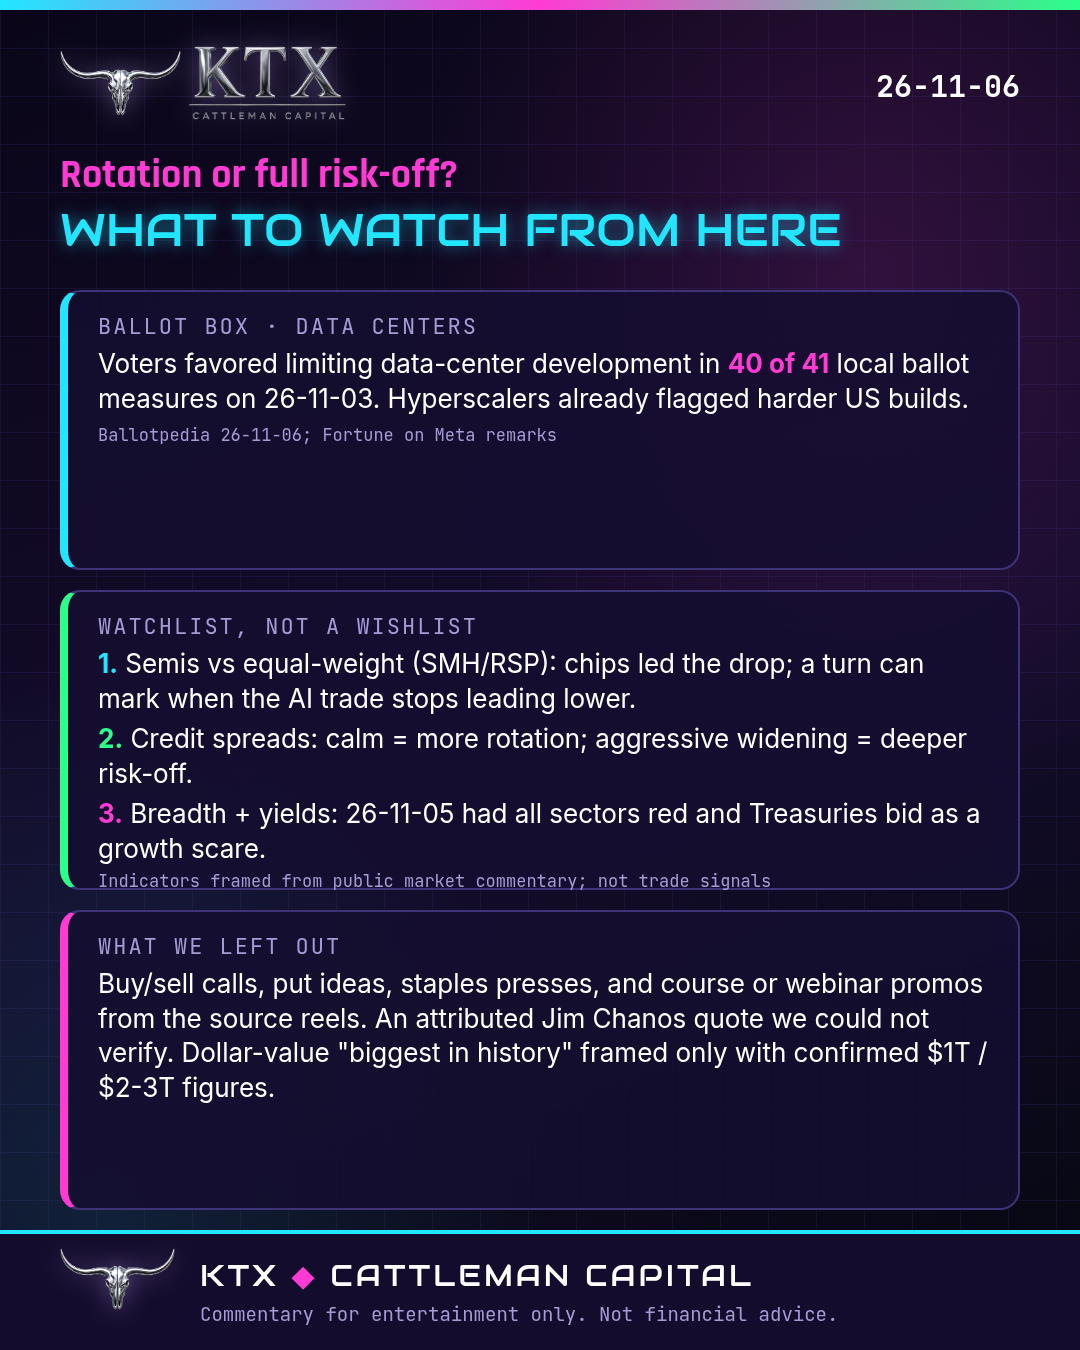
Investors had cheered the Democratic midterm sweep on Wednesday, then sold the AI complex on Thursday. The political read was that a friendlier Congress for broader fiscal priorities might also mean a harder path for data-center construction. Ballotpedia reported that voters favored limiting data-center development in 40 of 41 local ballot measures on 26-11-03 (Ballotpedia News, 26-11-06; CNBC, 26-11-04; verified). Fortune quoted Meta’s president saying US data-center builds are “going to be harder” and that hyperscalers are weighing capacity outside the United States (Fortune, 26-11-05; verified). Analyst Dan Ives brought forward his expected peak in tech capex growth and estimated that a slice of planned AI data centers could leave the US roadmap or face longer permitting (Fortune, 26-11-05).
Chip names absorbed the heaviest hits. Reporting on the day put Nvidia down more than 9%, with AMD and Micron among the double-digit decliners (CNBC, 26-11-05). The AI trade, already shaky in October, had its worst day since the pandemic-era March 2020 tape for several semiconductor gauges.
Rotation, risk-off, or a growth scare?
One reel cast Thursday as 2018-style midterm digestion that could still morph into full risk-off if defensive leadership fails alongside the market. Another framed it as a growth scare and pointed to two watch items: the semiconductor complex versus the equal-weighted S&P (a SMH/RSP style ratio), and credit spreads. We keep those as indicators, not as a playbook.
Semiconductors led the decline. A sustained turn in semis versus the equal-weighted index is one way market commentators mark when the AI complex stops leading lower. Credit is the second lens. If spreads stay relatively orderly while equities reprice growth expectations, the tape looks more like a sector rotation than classic risk-off. Aggressive spread widening would argue the other way. Thursday’s bond tape leaned toward the growth-scare read: Treasury yields fell as equities sold off, with short-end yields down more than longer-end yields in session reports.
What we left out
We dropped buy and sell language from both reels, including put ideas and “buy the dip” framing. We dropped a course and live-call promotion that asked viewers to comment for an invite. We dropped an attributed Jim Chanos line about selling beaten tech to buy low-growth consumer names at extreme multiples, because we could not verify that phrasing. We also did not republish an on-screen JPMorgan Democratic Sweep long/short basket as recommendations. Exact futures and ratio prints shown in one reel are treated as illustrations of the indicator idea. Closing index levels above come from Reuters and CNBC.
What the day itself points to watching next
Cloud and hyperscaler capex guidance, permitting and ballot follow-through on data centers, semiconductor relative strength versus the equal-weighted market, credit-spread behavior, and whether breadth stays this one-sided on subsequent sessions. Those are the markers the verified record of 26-11-05 leaves on the table.
Tie Your Horse to a Solid Post.
Sources
- https://www.cnbc.com/2026/11/05/stock-market-selloff-ai-fears.html
- https://fortune.com/2026/11/05/tech-stocks-are-suffering-the-biggest-selloff-since-covid-as-investors-see-premature-end-to-ai-datacenter-boom/
- https://news.ballotpedia.org/2026/11/06/voters-favored-limiting-data-center-development-in-40-of-41-local-ballot-measures-on-nov-3/
- https://www.cnbc.com/2026/11/04/data-center-ballot-measures-2026-midterm.html
On Trading Spaces
Week in Review and deeper dives
Full editions, the Friday Week in Review and longer deep dives publish first on the KTX channel, for Trading Spaces members.
Trading Spaces is a separate community with its own terms and privacy policy.
Provided by KTX Cattleman Capital, in conjunction with Trading Spaces. Commentary for entertainment only. Not financial advice.